
More Information
Submitted: October 03, 2023 | Approved: October 16, 2023 | Published: October 17, 2023
How to cite this article: El Khoury B, Khazaka S, Chalhoub N, Habib FA, Saba L, et al. Myosteatosis and Frailty Factors associated with the occurrence of Complications in Cirrhotic patients: MYOFACC study. Ann Clin Gastroenterol Hepatol. 2023; 7: 019-027.
DOI: 10.29328/journal.acgh.1001041
Copyright License: © 2023 El Khoury B, et al. This is an open access article distributed under the Creative Commons Attribution License, which permits unrestricted use, distribution, and reproduction in any medium, provided the original work is properly cited.
Keywords: PatternFrailty; Sarcopenia; Liver cirrhosis; Tomography; X-ray computed; Adiposity; Liver failure
Abbreviations: CT: Computerized Tomography; HU: Hounsfield Units; L2: Second Lumbar Vertebra; Kg: Kilogram; SMI: Skeletal Muscle Index; IMAC: Intramuscular Adipose Tissue Content

Myosteatosis and Frailty Factors associated with the occurrence of Complications in Cirrhotic patients: MYOFACC study
Bernard El Khoury*, S Khazaka, N Chalhoub, F Abi Habib, L Saba, Y Sarkis, K Honein, R Sayegh, R Slim and C Yaghi
Hôtel Dieu de France, Saint Joseph University, Faculty of Medicine, Beirut, Lebanon
*Address for Correspondence: Bernard El Khoury, Hôtel Dieu de France, Saint Joseph University, Faculty of Medicine, Beirut, Lebanon, Email: [email protected]
Background and aim: Cirrhosis leads to sarcopenia and to life-threatening complications in decompensated stages. The objective of this study is to show the impact of the loss of muscle mass and function on hepatic decompensations.
Methods: Our study compares a group of cirrhotic patients with controls matched with the same sex and age. A questionnaire was created to collect demographic, anthropometric, and cirrhosis characteristics. Several CT scan sections were analyzed and the average measurements have been grouped into tertiles to estimate the impact on cirrhotic complications.
Results: Our study included 33 controls and 33 cirrhotic patients of which 59.4% had NASH. Anthropometric characteristics were similar in cirrhotics men and women. Grip strength was significantly lower in cirrhotic men. Using the skeletal muscle index we found 39.39% of cirrhotic patients were sarcopenic mostly men 84.61%. In Cirrhotic men, the density of the psoas and paravertebral muscles was lower than in controls. In women psoas and paravertebral muscle areas were comparable and the total muscle surface in cirrhotic patients was higher. There was a negative correlation between this surface and the density of the psoas (r = -0.293 p = 0.017) indicating the presence of myosteatosis in women. Analysing tertile groups showed a significantly higher incidence of complications related to liver disease and liver failure in patients with the psoas and paravertebral muscle density in the lowest tertile and in the frail population according to the frailty index.
Conclusion: Cirrhotic patients have myosteatosis and sarcopenia associated with a higher incidence of complications related to hepatic failure.
The liver is a central organ with many crucial metabolic functions. In patients with chronic liver diseases, these functions are impaired resulting in a range of nutritional disorders and muscle abnormalities [1]. Sarcopenia - defined as the generalized loss of muscle mass, strength, and performance [2] - is described as the most common form of these abnormalities. The pathogenesis of this condition is complex and multifactorial and is more than just a simple reduction of protein and caloric intake [3]. Hyperammonemia appears to be the main driver of sarcopenia through several molecular signaling pathways [4]. Physiologic decline defined as frailty usually is associated with sarcopenia in cirrhotic patients and may predict important clinical outcomes including encephalopathy and mortality, independently of traditional predictors such as MELD score [2,5].
The assessment of sarcopenia appears to be complicated among patients with cirrhosis as most conventional methods may have some limitations [6,7]. For example, body mass index (BMI) and mid‐arm muscle circumference (MAMC), may be influenced by features such as ascites and peripheral fluid retention. Cross-sectional imaging assessment by CT is thus the most validated, accurate, and objective sarcopenia assessment tool [8,9] especially the analysis at the L3 level. The third lumbar vertebra skeletal muscle index (L3-SMI), defined as the muscle area at the L3 vertebra level divided by the patient's height (squared), is also an accepted tool for assessing sarcopenia. This specific method has been shown to be of higher accuracy in the diagnosis of sarcopenia in cirrhosis compared to anthropometry or DEXA scan [10]. In addition, CT attenuation of the muscles in patients with cirrhosis appears to be lower (indicative of fatty infiltration or myosteatosis) than in those without and such a feature has been correlated with adverse clinical outcomes [11].
The purpose of our research was mainly to show the clinical impact of the loss of muscle mass and function on hepatic decompensations and mortality rate in cirrhotic patients. We based our word on clinical, anthropometric, CT scan, and functional parameters in cirrhotic patients.
Type of study and population
Our study compares a group of cirrhotic patients with a control population matched with the same sex and age. The cirrhotic population included patients hospitalized, seen in clinics, or at the endoscopy unit during the years 2020-2021. The control population matched with the same sex and age characteristics includes patients without comorbidities seen in endoscopy for a screening examination or in radiology for an abdominopelvic scan found to be normal. The inclusion and exclusion criteria for cirrhotic patients are presented in Table 1.
| Table 1: Anthropometric, biological, and cirrhosis characteristics in men and women. | |||
| Men | Women | ||
| Anthropometric characteristics | Age | 68 ± 10 | 54 ± 17 |
| BMI | 27.6 ± 4.9 | 28.4 ± 7.1 | |
| Calf Circumference | 35.7 ± 4.7 | 35 ± 4.4 | |
| Neck Circumference | 36.7 ± 5.3 | 34.2 ± 4.3 | |
| Laboratory parameters | Albumin | 34 ± 6.9 | 37.2 ± 5.8 |
| Bilirubin | 26.9 ± 16.5 | 25 ± 18.1 | |
| INR | 1.43 ± 0.33 | 1.48 ± 0.466 | |
| MELD-Na score | 15 ± 5 | 14 ± 6 | |
| Liver decompensation | Presence of ascites | 7 (38.9%) | 8 (66.7%) |
| Absence of encephalopathy | 15 (83.3%) | 11 (91.7%) | |
| Encephalopathy Grade 1-2 | 2 (11.1%) | 1 (8.3%) | |
| Encephalopathy Grade 3-4 | 1 (5.6%) | 0 (0%) | |
| Child-Pugh B-C | 11 (55%) | 5 (41.7%) | |
| Etiology of liver disease | Non-alcoholic fatty liver disease | 11 (55%) | 8 (61.5%) |
| Cryptogenic etiology | 5 (25%) | 1 (7.7%) | |
| Autoimmune hepatitis /Primary biliary cirrhosis | 1 (5%) | 3 (23.1%) | |
| Medications/ HBV/Alcohol | 3 (15%) | 0 (0%) | |
| Budd Chiari | 0 (0%) | 1 (7.7%) | |
| Abbreviations: BMI: Body Mass Index; INR: International Normalized Ratio; MELD-Na: Model for End- SD and Stage Liver Disease-sodium; HBV: Hepatitis B Virus. | |||
Study outcomes
The primary outcome of the study was to show the impact of the loss of muscle mass and function on hepatic decompensations and mortality rate. Secondary outcomes were to determine clinical, anthropometric, CT, and functional parameters in cirrhotic patients compared between men and women, to calculate the prevalence of sarcopenia and myosteatosis after analyzing different CT sections and parameters, and to evaluate the difference of all of these parameters between cirrhotic men and women in order to find the best CT scan parameters to identify the loss of muscle mass and function.
Data collection
Data was collected by different gastroenterology interns using a questionnaire including demographic and anthropometric characteristics (weight, height, neck, and calve circumference), biological characteristics (blood creatinine level (in mmol/L), albumin level (in g/L), bilirubin level (in mmol/L), and INR level), characteristics of cirrhosis (etiology, CHILD, MELD Score, complications at decompensated stages), value of the grip strength, and the 30-second sit-stand test. Hand grip strength which is the maximum force/tension generated by one’s forearm muscles was measured using a CAMRY digital hand-held dynamometer (Figure S-1). The patient squeezes the dynamometer with all of their strength, typically three times at intervals of 5 minutes. An average score was then calculated, and the unit of measurement was noted in kilogram (Kg).
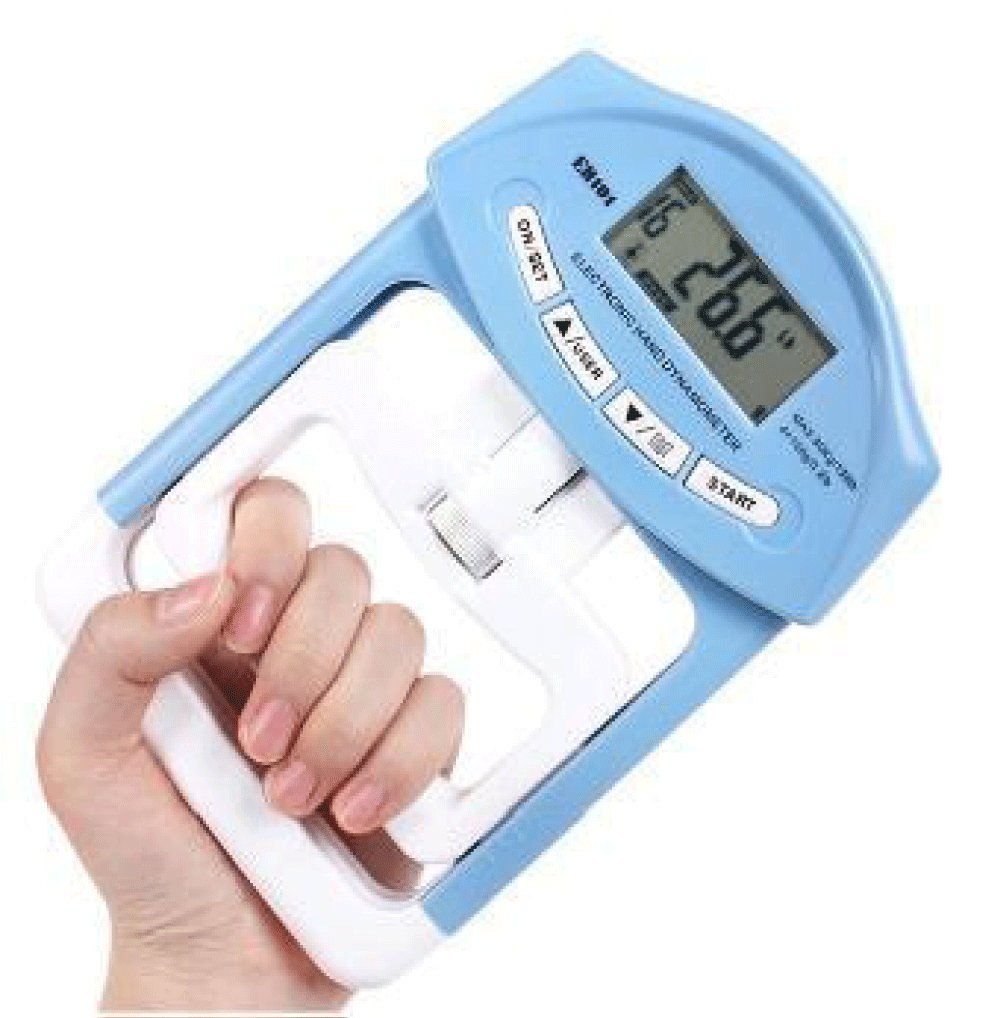
Figure S-1: CAMRY digital hand-held dynamometer.
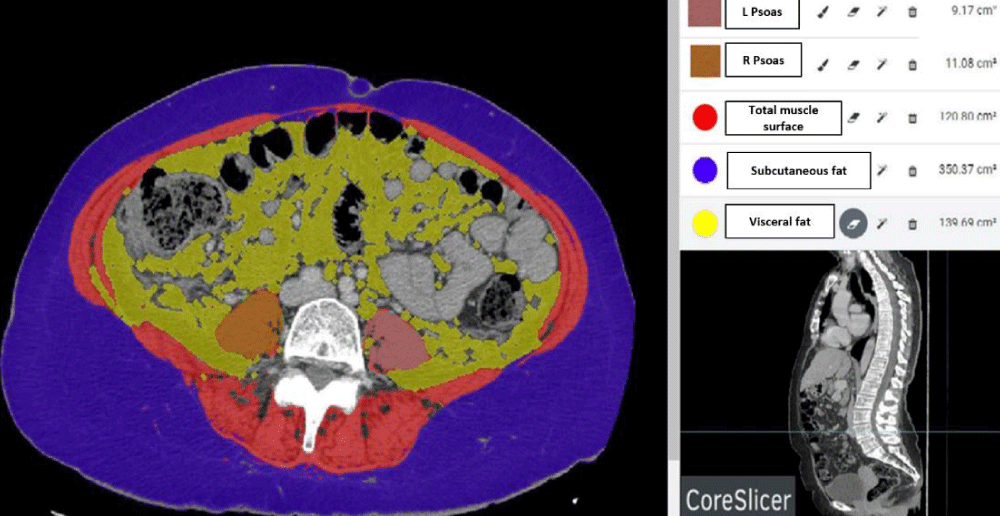
Figure S-2: Figure illustrating a cross-section of abdominal CT scan at the level of L3 showing psoas muscles, total muscle area, subcutaneous and visceral fat area using CoreSlicer software.
Several sections of CT scan were analyzed by the “Coreslicer” software, to measure the density and the area of the psoas muscle and the paravertebral muscles at different levels L2, L3, and L4 as well as the total muscle area, subcutaneous and visceral fat areas (Figure S-2).
Skeletal muscle was identified and quantified using Hounsfield Unit (HU) thresholds of −29 to +150. Muscles in the L3 region encompass psoas, erector spinae, quadratus lumborum, transversus abdominus, external and internal obliques, and rectus abdominus. The following HU thresholds were used for adipose tissues: −190 to −30 for subcutaneous and intermuscular adipose tissue, and −150 to −50 for visceral adipose tissue [12]. By using these specific HU thresholds, measurements of the skeletal muscle index are not influenced by the presence of ascites, overweight, or obesity in patients with cirrhosis [13]. Cross-sectional areas (cm2) were automatically computed by summing tissue pixels and multiplying by pixel surface area. The evaluation of sarcopenia was based on the value of the SMI according to the protocol described by Lijun Hou, et al. [14]. The SMI was calculated by dividing the skeletal muscle area (cm2) by the square of the height (m2). Sarcopenia was defined according to our previous publication as an SMI < 46.96 cm2/m2 for males and an SMI < 32.46 cm2/m2 for females [2]. Intramuscular adipose tissue content or IMAC is defined as the paravertebral muscle / subcutaneous fat tissue attenuation ratio. Increased IMAC was defined as a ratio > − 0.32 and > − 0.35 in female and male patients respectively [15]. L3 Psoas-RA defined as the lumbar 3 Psoas radiation attenuation was also selected. Low density was defined as an HU < 38.9 and < 40 in respectively female and male patients [15].
The average measurements of the different surfaces have been ranked into tertiles by going from the lowest to the highest values to estimate the impact on hepatic cirrhotic complications. Frailty was calculated based on the frail scale risk assessment score; the index classifies our population as Robust / Pre-Frail / Frail [16] (Table S-1). We determined for each group the mortality rate and the complications related to liver disease which were distributed as follows: events related to the liver disease in general: infection, gastrointestinal bleeding, ascites, hospitalization for complication, renal failure, etc.; and events related to Liver failure: as a separate entity.
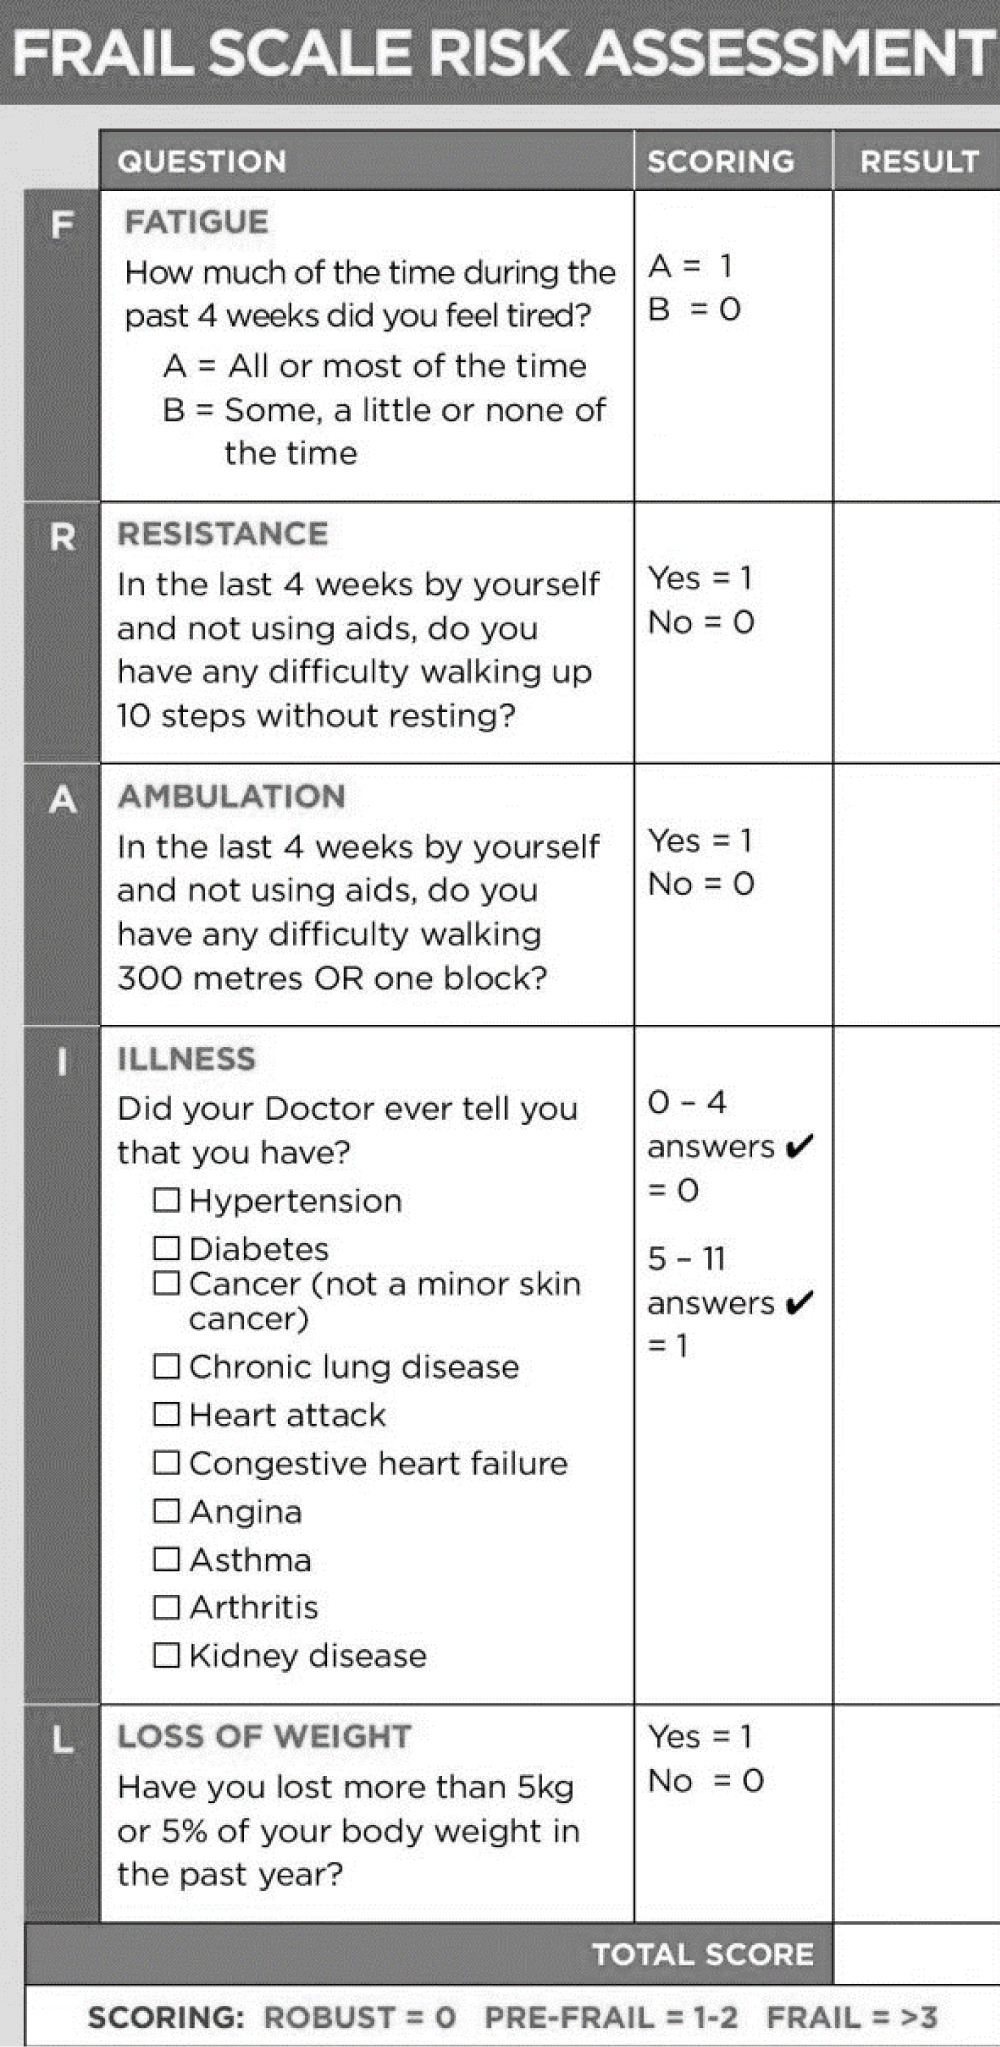
Table S-1: Table showing the Frail Scale.
Statistical analysis
IBM-SPSS 20.0 was used for statistical analysis. All the databases were then collected following the questionnaires and computerized in a table with several entries: Gender, age, etiology of the cirrhosis, values of the various elements of the blood test, the MELD and Child-Pugh scores, hand grip strength, the number of stand-ups during the sit-stand test over 30 seconds, Frailty score and CT scan parameters. Kolmogorov Smirnov test was used to test normality and found that most studied computed tomography parameters did not have a normal distribution. Mann-Whitney test was used to compare the differences between two independent groups when the dependent variable is either ordinal or continuous, but not normally distributed. This test was used to compare the results of CT sections in cirrhotic patients and in controls divided by sex. Spearman's rho was used to assess the correlation between anthropometric and dynamic measures and CT parameters. Pearson's Chi-square test was used to compare gender-specific differences and the effects of frailty on liver-related events.
The study was conducted in accordance with the Declaration of Helsinki, and the protocol was approved by the Ethics Committee of Saint Joseph University and Hotel Dieu de France Hospital (CEHDF 1755). Written informed consent was signed by each participant prior to inclusion in the study.
Population characteristics
Our study is a prospective cross-sectional study that compares a cirrhotic population with a control population matched with the same sex and age characteristics. A total of 55 cirrhotic patients were evaluated during the years 2020-2021 with only 33 patients meeting the inclusion criteria. (Table 1). In the end, 66 subjects were recruited: 33 controls and 33 cirrhotic patients (20 men aged 68 ± 10 years and 13 women aged 54 ± 17 years), of which 19 (59.4%) had non-alcoholic steatohepatitis and the rest autoimmune hepatitis / primary biliary cirrhosis, viral infection, alcohol, and other etiologies. In the cirrhotic population, anthropometric and biological characteristics were similar in men and women, only men were older and most of them (55%) had more severe disease Child-Pugh B-C compared to most women (58.3%) who were Child-Pugh A (Table 1).
Assessment of muscle mass and strength
Grip strength: Grip strength was significantly lower in cirrhotic males (29.07 ± 9 kg) compared to controls (37.18 ± 9.87 kg) (p = 0.004). The same difference was present in cirrhotic female patients but it wasn’t statistically significant (18.94 ± 6.5 kg vs. 20.08 ± 5.31 kg (p = 0.778)).
Sarcopenia: Considering the reference value of SMI = 46.96 cm2/m2 for males and 32.46 cm2/m2 for females (2) we found that in our population 39.39% (13/33) of cirrhotic patients are sarcopenic - mostly men 84.61% (11/13). Using the IMAC, 24% (8/33) of cirrhotic were found to have myosteatosis. There was no statistically significant difference between men and women for the SMI and the IMAC - only men had a greater total muscle surface area as well as a greater attenuation of the Psoas density indicating the higher presence of myosteatosis in men (Table 2).
| : Table comparing average CT parameters in men and women values are represented as mean ± SD and [median]. | |||
| Men | Women | p | |
| Average total muscle area L3 cm2 | 150.2 ± 44.6 [145] | 125.7 ± 32.5 [127] | 0.000 |
| SMI cm2/m2 | 53.3 ± 15.5 [50.9] | 47.6 ± 12.2 [48.8] | 0.425 |
| Paravertebral Muscle Density (HU) |
42.8 ± 12.6 [45] | 49 ± 18.4 [50.5] | 0.191 |
| Subcutaneous Fat tissue density (HU) |
89.6 ± 17.9 [95.3] | 87.7 ± 19.9 [94.5] | 0.839 |
| L3-IMAC | - 0.49 ± 0.14 [-0.51] | - 0.59 ± 0.31 [-0.54] | 0.461 |
| L3-Psoas-RA (HU) | 53.2 ± 31.2 [46.3] | 55 ± 9.6 [53.5] | 0.020 |
| L3-SMD | 46.4 ± 11.1 [46.5] | 50.7 ± 16.6 [52.5] | 0.098 |
| p value < 0.05 was considered significant Abbreviations: SMI: Skeletal Muscle Index; HU: Hounsfield Units; L3 Psoas-RA: Third Lumbar Psoas Radiation Attenuation; L3 IMAC: Third Lumbar Intramuscular Adipose Tissue Co; SMD: Skeletal Muscle Density. Statistically significant results were shaded. |
|||
Muscle mass and myosteatosis assessment
The comparison of the means of the different measurements of CT sections was made using the Mann-Whitney U and the results were displayed as mean ± standard deviation [median] (Tables S-2, S-3).
| Table S-2: Table comparing the means of the various measurements of CT sections of cirrhotic patients with those of controls (group of men). | |||
| Men | Cirrhosis Group | Control Group | p Value |
| Density Psoas R (HU) | 45.9 ± 8.25 [45.5] | 53.24 ± 4.66 [53] | 0.0029 |
| Density Psoas L (HU) | 45.45 ± 7.33 [46] | 54.41 ± 6.22 [56] | 0.0007 |
| Density Para vertebral R (HU) | 42.9 ± 12.88 [42] | 51.35 ± 9.69 [51] | 0.0365 |
| Density Para vertebral L (HU) | 43.1 ± 12.73 [46] | 51.65 ± 9.6 [55] | 0.0327 |
| Area Psoas L2 - L (cm²) | 6.32 ± 2.86 [5.48] | 7.54 ± 3.48 [6.91] | 0.1435 |
| Area Psoas L2 - R (cm²) | 5.91 ± 2.67 [4.97] | 7.54 ± 3.28 [7] | 0.0823 |
| Area Psoas L3 - L (cm²) | 8.69 ± 2.78 [8.34] | 10.88 ± 2.76 [10.67] | 0.0282 |
| Area Psoas L3 - R (cm²) | 8 ± 2.42 [8.11] | 10.93 ± 2.82 [10.5] | 0.0046 |
| Area Psoas L4 - L (cm²) | 12.09 ± 5.5 [11.81] | 14.07 ± 3.88 [12.65] | 0.0382 |
| Area Psoas L4 - R (cm²) | 12.17 ± 6.09 [10.77] | 13.4 ± 3.78 [13.15] | 0.0998 |
| Total Muscle Area L2 (cm²) | 140.41 ± 36.26 [132.44] | 147.61 ± 20.23 [152.81] | 0.19 |
| Total Muscle Area L3 (cm²) | 150.17 ± 44.63 [145.01] | 158.69 ± 22.85 [165.02] | 0.3145 |
| Total Muscle Area L4 (cm²) | 151.49 ± 32.67 [146.4] | 157.1 ± 24.21 [156.48] | 0.3934 |
| Subcutaneous fat Area L2 (cm²) | 155.11 ± 80.14 [150.77] | 177.55 ± 74.32 [157.14] | 0.3605 |
| Subcutaneous fat Area L3 (cm²) | 165.5 ± 73.23 [170.5] | 217.27 ± 74.03 [190.9] | 0.0588 |
| Subcutaneous fat Area L4 (cm²) | 207.72 ± 86.99 [220.71] | 255.34 ± 78.05 [232.4] | 0.0998 |
| Visceral fat Area L2 (cm²) | 213.48 ± 122.24 [205.57] | 189.38 ± 71.29 [192.82] | 0.5625 |
| Visceral fat Area L3 (cm²) | 222.18 ± 122.38 [212.93] | 195.08 ± 70.4 [192.29] | 0.6258 |
| Visceral fat Area L4 (cm²) | 215.65 ± 122.8 [204.05] | 192.24 ± 66.32 [207.74] | 0.6044 |
| Values are represented as mean ± SD and [median]. P value < 0.05 was considered significant (Grey Font) | |||
| Table S-3: Table comparing the means of the various measurements of CT sections of cirrhotic patients with those of controls (group of women). | |||
| Women | Cirrhosis Group | Control Group | P Value |
| Density Psoas R (HU) | 55.08 ± 9.77 [53] | 57.69 ± 10.51 [59] | 0.4424 |
| Density Psoas L (HU) | 54.92 ± 9.73 [54] | 56.81 ± 9.41 [58.5] | 0.5681 |
| Density Para vertebral R (HU) | 49.62 ± 16.69 [52] | 52.94 ± 15.72 [52] | 0.645 |
| Density Para vertebral L (HU) | 49.85 ± 18.82 [51] | 54.06 ± 17.13 [53] | 0.5387 |
| Area Psoas L2 - L (cm²) | 5.41 ± 1.42 [4.82] | 5.45 ± 1.29 [5.32] | 0.8608 |
| Area Psoas L2 - R (cm²) | 4.69 ± 1.18 [4.4] | 5.47 ± 1.37 [5.24] | 0.0956 |
| Area Psoas L3 - L (cm²) | 8.67 ± 2.97 [9.52] | 7.61 ± 2.19 [6.98] | 0.2364 |
| Area Psoas L3 - R (cm²) | 7.77 ± 2.74 [6.81] | 7.1 ± 2.25 [6.59] | 0.4829 |
| Area Psoas L4 - L (cm²) | 9.96 ± 2.5 [9.73] | 8.95 ± 2.34 [8.85] | 0.2542 |
| Area Psoas L4 - R (cm²) | 9.79 ± 2.6 [9.24] | 9.18 ± 2.54 [8.64] | 0.4829 |
| Total Muscle Area L2 (cm²) | 115.24 ± 27.68 [118.24] | 97.8 ± 25.08 [102.54] | 0.1144 |
| Total Muscle Area L3 (cm²) | 125.67 ± 32.57 [126.55] | 103.71 ± 22.43 [107.36] | 0.0437 |
| Total Muscle Area L4 (cm²) | 130.16 ± 33.88 [133.1] | 106.37 ± 24.14 [109.97] | 0.0485 |
| Subcutaneous fat Area L2 (cm²) | 207.69 ± 138.2 [174.08] | 211.24 ± 115.08 [185.11] | 0.8264 |
| Subcutaneous fat Area L3 (cm²) | 249.6 ± 159.15 [220.39] | 253.39 ± 120.98 [213.94] | 0.7257 |
| Subcutaneous fat Area L4 (cm²) | 307.4 ± 173.29 [258.93] | 310.35 ± 134.88 [315.75] | 0.6931 |
| Visceral fat Area L2 (cm²) | 120.03 ± 80.9 [101.56] | 109.96 ± 71.97 [104.83] | 0.7589 |
| Visceral fat Area L3 (cm²) | 138.32 ± 80.15 [125.19] | 123.07 ± 75.33 [103.27] | 0.4829 |
| Visceral fat Area L4 (cm²) | 136.62 ± 81.79 [112.54] | 130.23 ± 82.76 [131.61] | 0.965 |
| Values are represented as mean ± SD and [median]. p value < 0.05 was considered significant (Grey Font). | |||
In men, psoas muscle density (right and left combined) in cirrhotic patients was 45.7 ± 7.7 HU lower than in control subjects: 53.8 ± 4.9 HU (p = 0.001). The same difference was seen in the paravertebral muscles (right and left combined): 43.0 ± 1.2 HU vs. 51.5 ± 12.5 HU (p = 0.027). In addition, the surface of the psoas was smaller in cirrhotic than in controls at different levels (Table S-2; Histogram 1). In women, the surfaces of the psoas and paravertebral muscles were similar and the total muscle surface (123.7 ± 30.5 cm2) in cirrhotic was higher than in controls (102.6 ± 23 cm2) (p = 0.043) (Table S-3; Histogram 1).
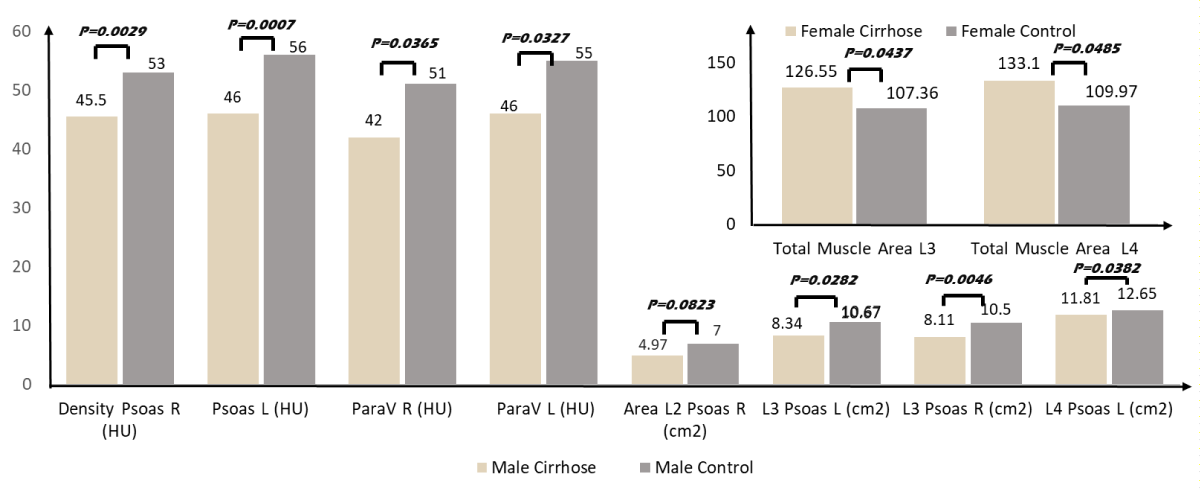
Histogram 1: Table showing the Frail Scale.
We also analyzed the correlation between the CT parameters and anthropometric measures. Age was the only factor associated with handgrip strength (r = -0,234; p = 0,016). Age was also correlated with the average muscle density of both psoas and paravertebral muscles (-0,371 et -0,530; p = 0,002 et 0,0001). BMI, calf, and neck circumferences were all correlated (r = 0,441, 0,349; p = 0,002, 0,017) with average subcutaneous fat area (AFSA) and average visceral fat area (AVFA) (r = 0,798, 0,668; p = 0,00). Whereas BMI and neck circumferences were correlated with average total muscular area (ATMA). We also noted that ATMA and AVFA were correlated. Correlation results are shown in Table 3.
| Table 3: Spearman Correlation between the different anthropometric and CT parameters. | ||||||||||
| Age | BMI | Calf | Neck | AD Psoas L2±L3±L4 | AD Parav | AA Psoas | ATMA | AVFA | ||
| Age | Rho | -0.121 | 0.13 | 0.139 | -0.371 | -0.53 | -0.103 | 0.055 | 0.293 | |
| p | 0.216 | 0.39 | 0.355 | 0.002 | < 0.001 | 0.412 | 0.66 | 0.017 | ||
| Hand Grip | Rho | -0.234 | 0.179 | 0.003 | 0.043 | 0.079 | 0.052 | 0.04 | 0.165 | 0.152 |
| p | 0.016 | 0.072 | 0.987 | 0.777 | 0.688 | 0.793 | 0.84 | 0.401 | 0.44 | |
| AD Psoas | Rho | -0.371 | -0.197 | -0.166 | -0.28 | |||||
| p | 0.002 | 0.297 | 0.407 | 0.158 | ||||||
| AD Parav | Rho | -0.53 | -0.184 | -0.252 | -0.382 | 0.624 | ||||
| p | 0 | 0.331 | 0.204 | 0.049 | 0 | |||||
| AA Psoas | Rho | -0.103 | 0.316 | 0.309 | 0.288 | -0.008 | 0.128 | |||
| p | 0.412 | 0.089 | 0.117 | 0.145 | 0.947 | 0.307 | ||||
| ATMA | Rho | 0.055 | 0.616 | 0.353 | 0.553 | -0.293 | -0.145 | 0.624 | ||
| p | 0.66 | < 0.001 | 0.071 | 0.003 | 0.017 | 0.245 | < 0.001 | |||
| AVFA | Rho | 0.293 | 0.668 | 0.423 | 0.541 | -0.523 | -0.298 | 0.343 | 0.448 | |
| p | 0.017 | < 0.001 | 0.028 | 0.004 | < 0.001 | 0.015 | 0.005 | < 0.001 | ||
| ASFA | Rho | -0.052 | 0.798 | 0.401 | 0.479 | -0.072 | -0.028 | 0.256 | 0.2 | 0.447 |
| p | 0.681 | < 0.001 | 0.038 | 0.011 | 0.566 | 0.822 | 0.038 | 0.107 | <0.001 | |
| Correlation coefficients with p < 0.05 are considered significant. Abbreviations: AD: Average Density; AA: Average Area; ATMA: Average Total Muscle Area; AVFA: Average Visceral Fat Area; ASFA: Average Subcutaneous Fat Area; Parav: Paravertebral. Statistically significant results were shaded. |
||||||||||
Complications prevalence dependent on CT parameters and frailty index
Our population was divided into gender-adjusted tertiles according to the CT parameters: Each tertile median and range is presented in Table 4. Using Pearson's Chi-square test significantly greater incidence of complications related to liver disease in general [11/20 (55%) p = 0.04] [13/20 (65%) p = 0.045] and liver failure in particular [10/16 (62.5%) p = 0.04] [12/17 (70.5%) p = 0.047] were present in cirrhotic patients of the lowest paravertebral and psoas density category respectively (tertile 1) (Table 4). The same greater incidence of complication was also present for the total muscle area category, but the results were statistically non-significant. There was no difference in the incidence of complications in the IMAC or the SMI categories.
| Table 4: The distribution of different liver-related events and liver failure-related events occurring in different tertiles of CT scan parameters and Frail scale classification. | ||||||||
| Percentile Groups Men / Women |
No LRE | LRE | p | No LFE | LFE | p | ||
| SMI L3 | Tertiles 1 | 37.7 [27.3 - 41.6] / 35.4 [25.6 - 40] | 3 (37.5) | 5 (25) | 0.267 | 5 (45.5) | 3 (17.6) | 0.053 |
| Tertiles 2 | 49.5 [43 - 60.1] / 48.8 [46 - 51.2] | 4 (50) | 6 (30) | 5 (45.5) | 5 (29.4) | |||
| Tertiles 3 | 68.2 [61.8 - 80.3] / 60.3 [52.7 - 66.8] | 1 (12.5) | 9 (45) | 1 (9.1) | 9 (53) | |||
| Total Muscle Area Density | Tertiles 1 | 37 [25.5 - 46] / 44 [29.5 - 48.8] | 2 (22.2) | 11 (55) | 0.168 | 3 (23.1) | 10 (62.5) | 0.089 |
| Tertiles 2 | 50.3 [46.5 - 51.3] / 54.5 [51 - 59] | 6 (66.7) | 6 (30) | 7 (53.8) | 5 (31.3) | |||
| Tertiles 3 | 56.3 [51.8 - 62.5] / 68 [61.8 - 76.8] | 1 (11.1) | 3 (15) | 3 (23.1) | 1 (6.2) | |||
| Psoas muscle density | Tertiles 1 | 38.2 [27.5 - 42.5] / 45 [37.5 -48] | 2 (22.2) | 13 (65) | 0.045 | 3 (25) | 12 (70.5) | 0.047 |
| Tertiles 2 | 46.7 [43.5 - 49] / 54 [52.5- 57] | 6 (66.7) | 4 (20) | 6 (50) | 4 (23.5) | |||
| Tertiles 3 | 54 [51.5 - 61] / 65.2 [58.5 - 73] | 1 (11.1) | 3 (15) | 3 (25) | 1 (6) | |||
| Paravertebral muscle density | Tertiles 1 | 31.5 [16 - 41] / 31 [21.5 - 49] | 0 (0) | 11 (55) | 0.004 | 1 (7.7) | 10 (62.4) | 0.004 |
| Tertiles 2 | 49 [42.5 - 53] / 52.5 [49.5 - 60] | 8 (88.9) | 5 (25) | 10 (76.9) | 3 (18.8) | |||
| Tertiles 3 | 58 [53.5 - 68] / 69.5 [63 - 80.5] | 1 (11.1) | 4 (20) | 2 (15.4) | 3 (18.8) | |||
| L3 subcutaneous fat density | Tertiles 1 | -107.8 [-115.5 - -104] / -105.5 [-115.5 - -103] | 4 (44.4) | 2 (10) | 0.018 | 4 (30.8) | 2 (12.5) | 0.006 |
| Tertiles 2 | -100 [-103.5 - -94] / -99 [-102.5 - -96] | 4 (44.4) | 5 (25) | 7 (53.8) | 2 (12.5) | |||
| Tertiles 3 | -77.5 [-93 - -44.5] / -83 [-94.5 - -44] | 1 (11.2) | 13 (65) | 2 (15.4) | 12 (75) | |||
| IMAC | Tertiles 1 | -0.6 [-0.8 - -0.6] / -0.8 [-1.4 - -0.6] | 2 (22.2) | 7 (35) | 0.702 | 4 (30.8) | 5 (31.3) | 0.904 |
| Tertiles 2 | -0.5 [-0.6 - -0.5] / -0.5 [-0.6 - -0.5] | 4 (44.4) | 6 (30) | 5 (38.5) | 5 (31.3) | |||
| Tertiles 3 | -0.3 [-0.5 - -0.2] / -0.3 [-0.5 - -0.2] | 3 (33.4) | 7 (35) | 4 (30.8) | 6 (37.4) | |||
| Frail | Robust | 5 (55.6) | 3 (16.7) | 0.037 | 6 (50) | 2 (13.3) | 0.038 | |
| Pre-frail /frail | 4 (44.4) | 15 (83.3) | 6 (50) | 13 (86.7) | ||||
| Values are represented as mean [min value – max value] and as (percentage). p value < 0.05 was considered significant Abbreviations: LRE: Liver Related Events; LFE: Liver Failure Events; SMI: Skeletal Muscle Index; L3: Third Lumbar; IMAC: Intramuscular Adipose Tissue Content Statistically significant results were shaded. |
||||||||
Finally, when dividing our population into robust, pre-frail, and frail according to the frailty scale risk assessment score decompensations related to liver disease and hepatic failure were statistically significant in the frail population (15/18 (83%) in men p = 0.037, 13/15 (86%) in women p = 0.038). We observed more mortality rate in the frail population (70.4%), but the results were statistically non-significant (p = 0.826). (Table 4).
This is the first cross-sectional observational study to assess the prevalence of sarcopenia depending on the CT scan parameters and its impact on cirrhotic complications in the Lebanese population. Our finding that 39.4% of cirrhotic patients are sarcopenic is in line with results from a recent study that showed a prevalence of sarcopenia around 44.4% when defined by third Lumbar-Skeletal Muscle Index (L3-SMI) [13] and from another prospective study of 159 outpatients with cirrhosis of which 43% of patients had sarcopenia (57% of men and 25% of women) [8].
Muscle mass quantification with cross-sectional imaging studies [computed tomography (CT) scan, or magnetic resonance imaging (MRI)] constitutes an objective and reproducible technique of nutritional status in cirrhosis. Moreover, muscularity assessment with cross-sectional imaging studies is not biased by the fluid overload status that frequently is present in decompensated cirrhosis, and sarcopenia seems to reflect a chronic detriment in the general physical condition, rather than acute severity of the liver disease. Choosing cross-sectional muscle area at either the level of the third (L3) or fourth (L4) lumbar vertebrae is based on the good correlation between these parameters with total body muscle mass [10]. It is now the most commonly employed method in studies investigating sarcopenia in cirrhosis [17].
In a first study, the diameter of the psoas muscle at the level of the umbilicus predicted the mortality of patients on the liver transplant list [18]. In a second single-center study the analysis of several measurements of the psoas muscle (density and surface area) at the L3 level showed superiority in the prediction of 1-year mortality compared to body mass index [19]. However, the majority of these studies assessed sarcopenia based on quantity and did not consider the quality of muscle mass.
Moreover, the measurement of the psoas muscle density and surface has been considered by several groups of authors as a possible alternative [13]. In our study, the importance of the use of psoas and the paravertebral muscle densities compared to SMI and IMAC was demonstrated in the tertile analysis of our population. The differences in complications were not statistically significant with either SMI or IMAC categories (Table 4). Measuring Psoas or paravertebral muscles rather than all skeletal muscle areas is simpler, faster, and probably more informative because ascites and associated abdominal wall edema may render measurements of peripheral abdominal skeletal muscle less accurate. Golse, et al. showed that among many tools including SMI, psoas major area (PMA) at the L3 or L4 level was the best method to predict 1-year post-transplantation mortality [19].
The presence of sarcopenia defined by the loss of muscle mass and strength has been demonstrated in our cirrhotic population in several ways. First, hand grip strength was weaker in both men and women. This difference was not statistically significant in women, probably due to the lower number of women in our study. Second, the density and the area of the psoas and paravertebral muscles were much weaker in the cirrhotic group compared to controls, a statistically significant difference seen only in men (Table S-2). An open question remains of why the observed alterations were more profound in males. Actually, frailty patients have multiple endocrine changes, such as reduced concentrations of testosterone which plays a positive role in protein synthesis and muscle mass. Its concentration decreases with age and during cirrhosis which promotes the secretion of myostatin and thus contributes to muscle autophagy [20]. This is supported by a recent study that demonstrated a correlation between testosterone levels, sarcopenia, and overall mortality [21].
The role of myosteatosis in our study was demonstrated also in different ways. First, the area of the total abdominal muscle was greater in female cirrhotic patients than in controls (Table S-3). A negative correlation between this area and the density of the psoas was present in women indicating fat infiltration (myosteatosis) (Table 3). In fact, evidence shows that women have greater myosteatosis than men, regardless of differences in body mass index (BMI). Second, this myosteatosis was also demonstrated in men with the correlation between psoas and paravertebral density and visceral fat area (Table 3) which was higher in the cirrhotic population (Table 3). Third, a statistically significant correlation between age handgrip strength, psoas muscle density, and paravertebral muscle density was present. In other words, muscle strength decreases with age probably due to intramuscular fatty infiltration which decreases muscle density.
Sarcopenia may be a key predictor of reduced quality of life from longer hospital and intensive care unit stays, [22] higher incidence of infection after liver transplantation, and [18] higher overall health care costs. The prognostic importance of sarcopenia in cirrhosis is becoming well recognized with multiple reports that are associated with morbidity and mortality independent of the MELD score [18]. Sarcopenia can be a key predictor of longer hospital and intensive care unit stays [22], higher incidence of infection following LT [18], and higher overall healthcare costs. It has been shown in our study that 55% and 65% of complications related to hepatopathy in general (infection, ascites, acute variceal bleeding, hospitalization for complication, renal insufficiency, etc.) and 62.5% and 70.5% of complications related to hepatic failure were present in the group with the lowest paravertebral and psoas muscle density respectively. Our results suggest that the prognostic usefulness of psoas and paravertebral muscles, although suboptimal, is superior to that of other adjusted measurements (Table 4).
In the setting of cirrhosis and portal hypertension, the decreased hepatic clearance of ammonia leads to significant dependence on skeletal muscle for ammonia detoxification. Patients with lower muscle mass and sarcopenia may have a decreased ability to compensate for hepatic insufficiency and a higher likelihood of developing physiologically significant hyperammonemia and hepatic encephalopathy. Supporting this, sarcopenia is almost 2-fold more prevalent in patients with overt HE compared to those without HE (53% vs. 32%, p < 0.001) [11].
We also found more decompensations related to liver disease and hepatic failure (83.3% and 86.7% respectively) in the frail population. Sarcopenia is not identical to frailty. Frailty is a more multidimensional concept encompassing not only muscle conditions but also exhaustion, well-being, disability, dependency, and cognitive state. It was independently predictive of falls, loss of mobility, disability, hospitalization, and death [23].
We recognize the following limitations in our study. First, a selection bias is present as only patients evaluated with a CT scan were included. In fact, many cirrhotic patients didn’t have any radiologic exam in the previous year or had an MRI prescribed to screen for hepatocellular carcinoma. This selection criteria along with the COVID-19 pandemic contributed widely to the low number of recruited patients. Second, some confounding factors could have led to potential bias. Patients with higher MELD, and higher age are prone to more infection, hepatic decompensation, acute-on-chronic liver failure, prolonged hospitalization, and other factors that increase mortality. Therefore, it is possible that the relative contribution of sarcopenia may be lower after adjusting factors associated with mortality. Finally, neither the European Association for the Study of the Liver (EASL) nor the ESPEN recommend cut-offs to define sarcopenia and frailty [17,24]. We used higher cut-offs in our study leading probably to overestimating the prevalence of sarcopenia.
In conclusion, sarcopenia affects about 40% of patients with cirrhosis and predicts with frailty important clinical outcomes, including mortality and cirrhotic decompensation. Its presence with myosteatosis has been demonstrated by hand grip strength, and several CT scan parameters including muscle density, muscle surfaces, and different correlations. Measuring Psoas or paravertebral muscles rather than all skeletal muscle areas is simpler, faster, and probably more informative especially in terms of prognostic and complications. These parameters with their high accessibility and feasibility might enable clinicians to diagnose low muscle mass in daily clinical practice and thus select patients with a higher risk of complications needing closer monitoring. Further prospective studies on larger groups of patients are needed to incorporate sarcopenia or muscle mass index/function into a prognostic scale for patients with cirrhosis. Additional studies are also needed to understand more about the physiologic relationship that may point to novel therapeutic targets, including nutritional, pharmacologic, and perhaps physical interventions.
- Ebadi M, Tsien C, Bhanji RA, Dunichand-Hoedl AR, Rider E, Motamedrad M, Mazurak VC, Baracos V, Montano-Loza AJ. Myosteatosis in Cirrhosis: A Review of Diagnosis, Pathophysiological Mechanisms and Potential Interventions. Cells. 2022 Apr 4;11(7):1216. doi: 10.3390/cells11071216. PMID: 35406780; PMCID: PMC8997850.
- Feng H, Wang X, Mao L, Yu Z, Cui B, Lin L, Hui Y, Zhao X, Xu X, Fan X, Wang B, Yu Q, Jiang K, Sun C. Relationship between sarcopenia/myosteatosis and frailty in hospitalized patients with cirrhosis: a sex-stratified analysis. Ther Adv Chronic Dis. 2021 Jul 27;12:20406223211026996. doi: 10.1177/20406223211026996. PMID: 34377386; PMCID: PMC8320564.
- Bunchorntavakul C, Reddy KR. Review article: malnutrition/sarcopenia and frailty in patients with cirrhosis. Aliment Pharmacol Ther. 2020 Jan;51(1):64-77. doi: 10.1111/apt.15571. Epub 2019 Nov 8. PMID: 31701570.
- Wijarnpreecha K, Werlang M, Panjawatanan P, Kroner PT, Cheungpasitporn W, Lukens FJ, Pungpapong S, Ungprasert P. Association between sarcopenia and hepatic encephalopathy: A systematic review and meta-analysis. Ann Hepatol. 2020 May-Jun;19(3):245-250. doi: 10.1016/j.aohep.2019.06.007. Epub 2019 Jul 13. PMID: 31422030.
- Farkas ZC, Rashid T, Chen YS, Siddiqui TM, Yandrapalli S, Frager S, Aronow WS, Bodin R, Maddineni S. The correlation between sarcopaenia and post-transjugular intrahepatic portosystemic shunt hepatic encephalopathy: a single-institution review. Arch Med Sci Atheroscler Dis. 2019 May 27;4:e89-e93. doi: 10.5114/amsad.2019.85380. PMID: 31211275; PMCID: PMC6554751.
- Sinclair M, Gow PJ, Grossmann M, Angus PW. Review article: sarcopenia in cirrhosis--aetiology, implications and potential therapeutic interventions. Aliment Pharmacol Ther. 2016 Apr;43(7):765-77. doi: 10.1111/apt.13549. Epub 2016 Feb 5. PMID: 26847265.
- Santos LAA, Lima TB, Ietsugu MDV, Nunes HRC, Qi X, Romeiro FG. Anthropometric measures associated with sarcopenia in outpatients with liver cirrhosis. Nutr Diet. 2019 Nov;76(5):613-619. doi: 10.1111/1747-0080.12523. Epub 2019 Mar 14. PMID: 30869199.
- Tandon P, Low G, Mourtzakis M, Zenith L, Myers RP, Abraldes JG, Shaheen AA, Qamar H, Mansoor N, Carbonneau M, Ismond K, Mann S, Alaboudy A, Ma M. A Model to Identify Sarcopenia in Patients With Cirrhosis. Clin Gastroenterol Hepatol. 2016 Oct;14(10):1473-1480.e3. doi: 10.1016/j.cgh.2016.04.040. Epub 2016 May 14. Erratum in: Clin Gastroenterol Hepatol. 2022 Jun;20(6):1423. PMID: 27189915.
- Giusto M, Lattanzi B, Albanese C, Galtieri A, Farcomeni A, Giannelli V, Lucidi C, Di Martino M, Catalano C, Merli M. Sarcopenia in liver cirrhosis: the role of computed tomography scan for the assessment of muscle mass compared with dual-energy X-ray absorptiometry and anthropometry. Eur J Gastroenterol Hepatol. 2015 Mar;27(3):328-34. doi: 10.1097/MEG.0000000000000274. PMID: 25569567.
- Paternostro R, Lampichler K, Bardach C, Asenbaum U, Landler C, Bauer D, Mandorfer M, Schwarzer R, Trauner M, Reiberger T, Ferlitsch A. The value of different CT-based methods for diagnosing low muscle mass and predicting mortality in patients with cirrhosis. Liver Int. 2019 Dec;39(12):2374-2385. doi: 10.1111/liv.14217. Epub 2019 Sep 11. PMID: 31421002; PMCID: PMC6899596.
- Bhanji RA, Moctezuma-Velazquez C, Duarte-Rojo A, Ebadi M, Ghosh S, Rose C, Montano-Loza AJ. Myosteatosis and sarcopenia are associated with hepatic encephalopathy in patients with cirrhosis. Hepatol Int. 2018 Jul;12(4):377-386. doi: 10.1007/s12072-018-9875-9. Epub 2018 Jun 7. PMID: 29881992.
- Mullie L, Afilalo J. CoreSlicer: a web toolkit for analytic morphomics. BMC Med Imaging. 2019 Feb 11;19(1):15. doi: 10.1186/s12880-019-0316-6. PMID: 30744586; PMCID: PMC6371488.
- Tantai X, Liu Y, Yeo YH, Praktiknjo M, Mauro E, Hamaguchi Y, Engelmann C, Zhang P, Jeong JY, van Vugt JLA, Xiao H, Deng H, Gao X, Ye Q, Zhang J, Yang L, Cai Y, Liu Y, Liu N, Li Z, Han T, Kaido T, Sohn JH, Strassburg C, Berg T, Trebicka J, Hsu YC, IJzermans JNM, Wang J, Su GL, Ji F, Nguyen MH. Effect of sarcopenia on survival in patients with cirrhosis: A meta-analysis. J Hepatol. 2022 Mar;76(3):588-599. doi: 10.1016/j.jhep.2021.11.006. Epub 2021 Nov 14. PMID: 34785325.
- Hou L, Deng Y, Fan X, Zhao T, Cui B, Lin L, Hou J, Mao L, Zhao W, Jiang K, Wang B, Zhang J, Sun C. A Sex-Stratified Prognostic Nomogram Incorporating Body Compositions for Long-Term Mortality in Cirrhosis. JPEN J Parenter Enteral Nutr. 2021 Feb;45(2):403-413. doi: 10.1002/jpen.1841. Epub 2020 May 2. PMID: 32359094.
- Meister FA, Bednarsch J, Amygdalos I, Boecker J, Strnad P, Bruners P, Lang SA, Ulmer TF, Heij L, Santana DAM, Liu WJ, Lurje G, Neumann UP, Czigany Z. Various myosteatosis selection criteria and their value in the assessment of short- and long-term outcomes following liver transplantation. Sci Rep. 2021 Jun 28;11(1):13368. doi: 10.1038/s41598-021-92798-5. PMID: 34183733; PMCID: PMC8239038.
- Gleason LJ, Benton EA, Alvarez-Nebreda ML, Weaver MJ, Harris MB, Javedan H. FRAIL Questionnaire Screening Tool and Short-Term Outcomes in Geriatric Fracture Patients. J Am Med Dir Assoc. 2017 Dec 1;18(12):1082-1086. doi: 10.1016/j.jamda.2017.07.005. Epub 2017 Aug 31. PMID: 28866353; PMCID: PMC6611671.
- Buchard B, Boirie Y, Cassagnes L, Lamblin G, Coilly A, Abergel A. Assessment of Malnutrition, Sarcopenia and Frailty in Patients with Cirrhosis: Which Tools Should We Use in Clinical Practice? Nutrients. 2020 Jan 9;12(1):186. doi: 10.3390/nu12010186. PMID: 31936597; PMCID: PMC7020005.
- Dhaliwal A, Williams FR, El-sherif O, Armstrong MJ. Sarcopenia in Liver Transplantation: an Update. Curr Hepatol Rep. 2020 Jun; 19(2):128–37.
- Golse N, Bucur PO, Ciacio O, Pittau G, Sa Cunha A, Adam R, Castaing D, Antonini T, Coilly A, Samuel D, Cherqui D, Vibert E. A new definition of sarcopenia in patients with cirrhosis undergoing liver transplantation. Liver Transpl. 2017 Feb;23(2):143-154. doi: 10.1002/lt.24671. Epub 2017 Jan 6. PMID: 28061014.
- Nishikawa H, Enomoto H, Ishii A, Iwata Y, Miyamoto Y, Ishii N, Yuri Y, Hasegawa K, Nakano C, Nishimura T, Yoh K, Aizawa N, Sakai Y, Ikeda N, Takashima T, Takata R, Iijima H, Nishiguchi S. Elevated serum myostatin level is associated with worse survival in patients with liver cirrhosis. J Cachexia Sarcopenia Muscle. 2017 Dec;8(6):915-925. doi: 10.1002/jcsm.12212. Epub 2017 Jun 18. PMID: 28627027; PMCID: PMC5700437.
- Sinclair M, Grossmann M, Angus PW, Hoermann R, Hey P, Scodellaro T, Gow PJ. Low testosterone as a better predictor of mortality than sarcopenia in men with advanced liver disease. J Gastroenterol Hepatol. 2016 Mar;31(3):661-7. doi: 10.1111/jgh.13182. PMID: 26414812.
- Kang SH, Jeong WK, Baik SK, Cha SH, Kim MY. Impact of sarcopenia on prognostic value of cirrhosis: going beyond the hepatic venous pressure gradient and MELD score. J Cachexia Sarcopenia Muscle. 2018 Oct;9(5):860-870. doi: 10.1002/jcsm.12333. PMID: 30371017; PMCID: PMC6204582.
- Wang S, Whitlock R, Xu C, Taneja S, Singh S, Abraldes JG, Burak KW, Bailey RJ, Lai JC, Tandon P. Frailty is associated with increased risk of cirrhosis disease progression and death. Hepatology. 2022 Mar;75(3):600-609. doi: 10.1002/hep.32157. Epub 2021 Dec 5. PMID: 34528267.
- European Association for the Study of the Liver. Electronic address: [email protected]; European Association for the Study of the Liver. EASL Clinical Practice Guidelines on nutrition in chronic liver disease. J Hepatol. 2019 Jan;70(1):172-193. doi: 10.1016/j.jhep.2018.06.024. Epub 2018 Aug 23. PMID: 30144956; PMCID: PMC6657019.